Florida, as with the rest of the planet, is experiencing record-breaking high temperatures. Urban areas, in particular, have experienced the most dramatic increases in temperatures. Miami, for example, experienced an unprecedented 60 days with a heat index above 105°F in 2024. People living in urban areas not only experience higher temperatures but also experience them for longer. In five large Florida cities (Hialeah, Miami, Ft. Lauderdale, Ft. Myers, and West Palm Beach), the hot season is now longer by three or more weeks.
In a nutshell, in developed areas, natural ground cover, like trees and other vegetation, has been replaced by artificial impermeable surfaces, such as asphalt, concrete, and metal. Unlike plants, which decrease ground surface temperatures through evapotranspiration, human-made impermeable surfaces increase ground surface temperatures by increasing heat absorption, storage, and transmission, and by reducing airflow. Consequently, people living in developed areas, particularly in urban areas, experience higher felt temperatures.
Some areas experience significantly higher surface temperatures than the surrounding landscape, a phenomenon known as the “urban heat island” (UHI) effect. Extreme heat is the deadliest weather-related hazard in the US and is recognized by the World Health Organization as a global health risk. As temperatures rise, the UHI effect will increasingly make our neighborhoods and towns unbearably hot, posing a serious threat to public health.
Despite being recognized as the deadliest climate-related hazard in the US, Florida’s statutorily required vulnerability assessment (Resilient Florida / F.S. 380.093) largely addresses infrastructure resilience to coastal flooding and does not require municipalities to include surface temperatures, extreme heat, or public health impacts of urban heat island (UHI).
Simply put, we conduct a temperature vulnerability analysis using geospatial analysis software to create a Population Vulnerability Index Map that classifies areas, especially UHIs, according to the risk they pose to public health, especially to vulnerable populations. We do this by:
This approach can also increase the effectiveness of mitigation efforts by identifying locations where actions, such as increasing tree canopy cover, are most likely to lower surface temperatures.
I mapped the surface temperatures of the City of Atlantis, where my family and I are currently residing. Atlantis, located about 90 miles north of Miami, is fairly unique in that it is almost entirely contained within the City’s walls. The City’s two golf courses provide little tree cover, but their turf increases plant ground cover and lowers the percentage of impervious surfaces. So, what do the surface temps look like in Atlantis? Let’s take a look.
This is not a full vulnerability assessment; it quantifies and maps three key inputs of temperature vulnerability analysis – surface temperature, canopy, and imperviousness – to map surface temperatures and identify where mitigation might be most effective. A formal vulnerability analysis requires a greater time investment than I can provide here.
Methods
Caveats
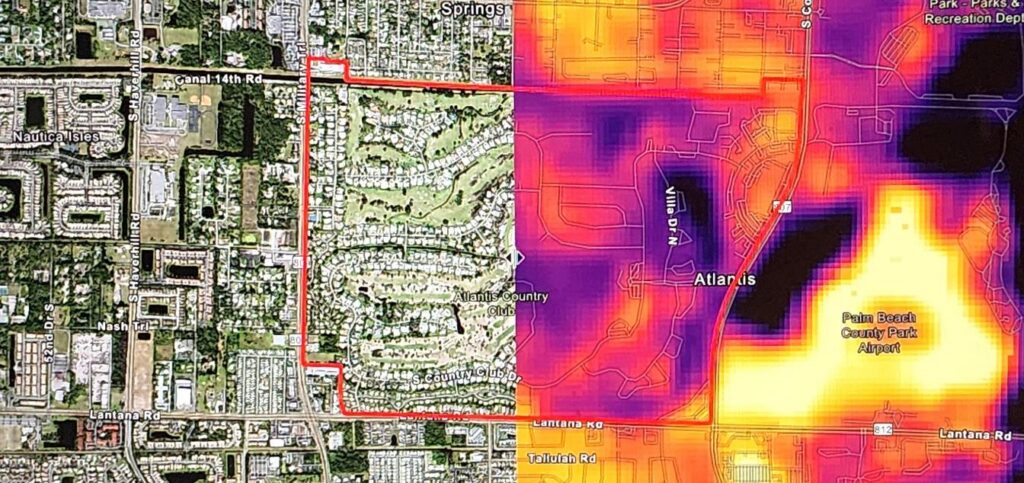
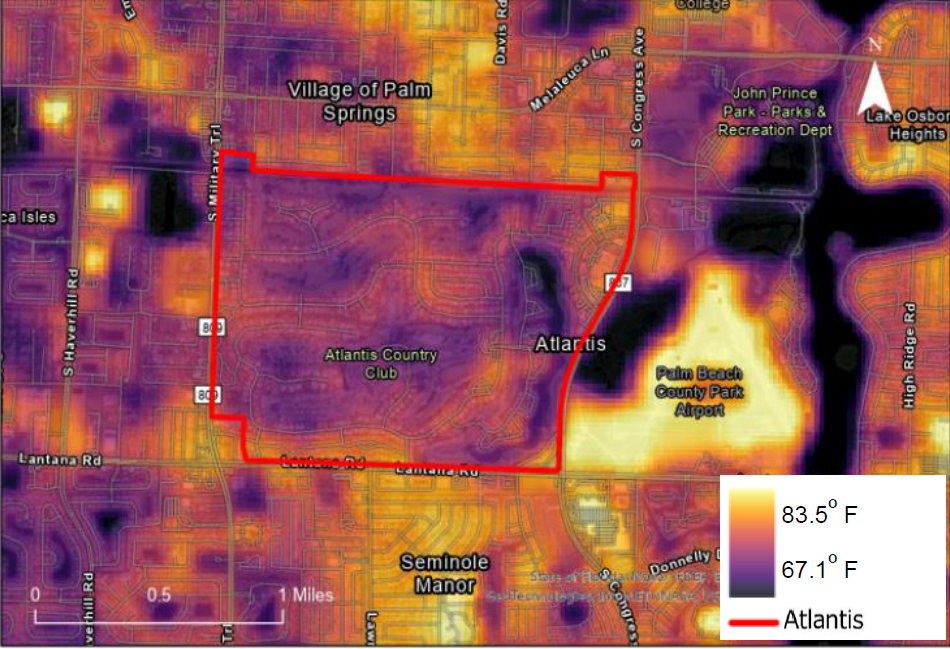
I created an average summer (June–August) surface temperature map for Atlantis and its immediate surroundings using Thermal Infrared Sensor (TIRS) satellite data collected between 2015 and 2023. Surface temperatures were averaged for summer days with less than 10% cloud cover and displayed as a continuous color gradient, with lower temperatures shown in darker colors and higher temperatures in lighter colors (Figures 1 and 2).
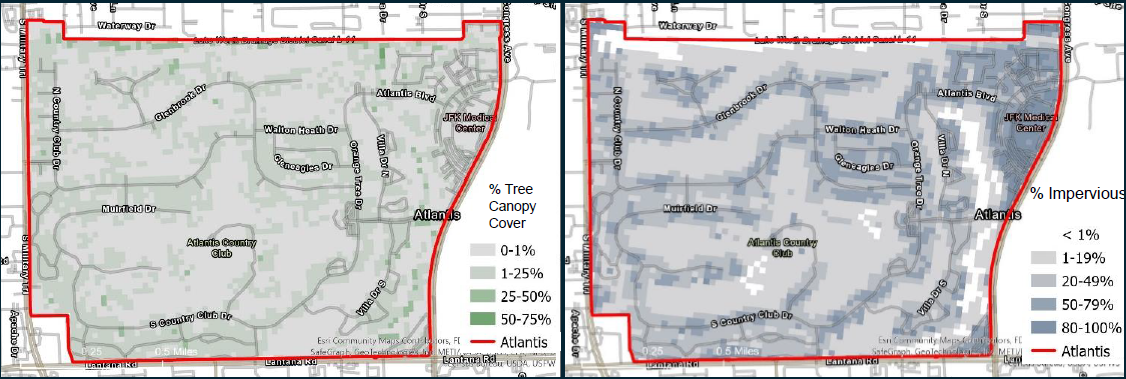
I also mapped two landscape features that strongly influence surface temperatures: percent canopy cover and percent impervious surfaces. The former describes the proportion of ground surface covered by trees, and the latter, the proportion of ground covered by surfaces such as asphalt and concrete that absorb and store solar energy as heat. These maps were constructed using 2021 National Land Cover Land Use satellite data with a 30-meter resolution. Canopy and impervious surface percent cover are each displayed as a color gradient of percentage-cover classes, with lower ground-cover percentages shown in lighter colors and higher percentages in darker colors (Figure 3).
Currently, there is no explicit definition of an urban heat island. I will refer to those areas within Atlantis with visibly higher surface temperatures as heat islands since they are more likely to contribute to increased local air temperatures than other areas.
Looking at surface temperatures in Atlantis and the surrounding area (Figure 1) can lead to several interesting observations. Immediately noticeable is how much temperatures vary greatly across the landscape, with distinct hotspots and strikingly lower temperatures in tree-covered areas. Also noticeable is that, overall, surface temperatures within Atlantis are lower than in many surrounding areas.
Not surprisingly, Palm Beach County Lantana Airport, with its large runway and exposed ground surface area, is the most prominent heat island outside of Atlantis. Northwest of Atlantis (Figure 1) are three prominent heat islands that exemplify how not to construct energy-efficient, climate-adaptive rooftops—large, black, flat surfaces that absorb heat efficiently.
Average summer (June–August) surface temperatures within Atlantis range from 67.1°F to 83.5°F, with an average of 75.6°F (Standard Deviation ± 2.8°F) (Figure 2). For comparison, the average summer surface temperature of the tree covered area adjacent to the Palm Beach County Lantana Airport is 69 °F.
The City’s two golf courses are noticeably cooler (Figure 2) and largely account for Atlantis’s very low and highly variable percent tree canopy cover (Figure 3), with an average of only 6.8% canopy cover (Standard Deviation ± 8.3%). In an apparent contradiction, they also account for most of the area in Atlantis with lower surface temperatures. Although the golf courses have little canopy cover, they help reduce surface temperatures through evapotranspiration of the turf, but at the cost of significant water resources.
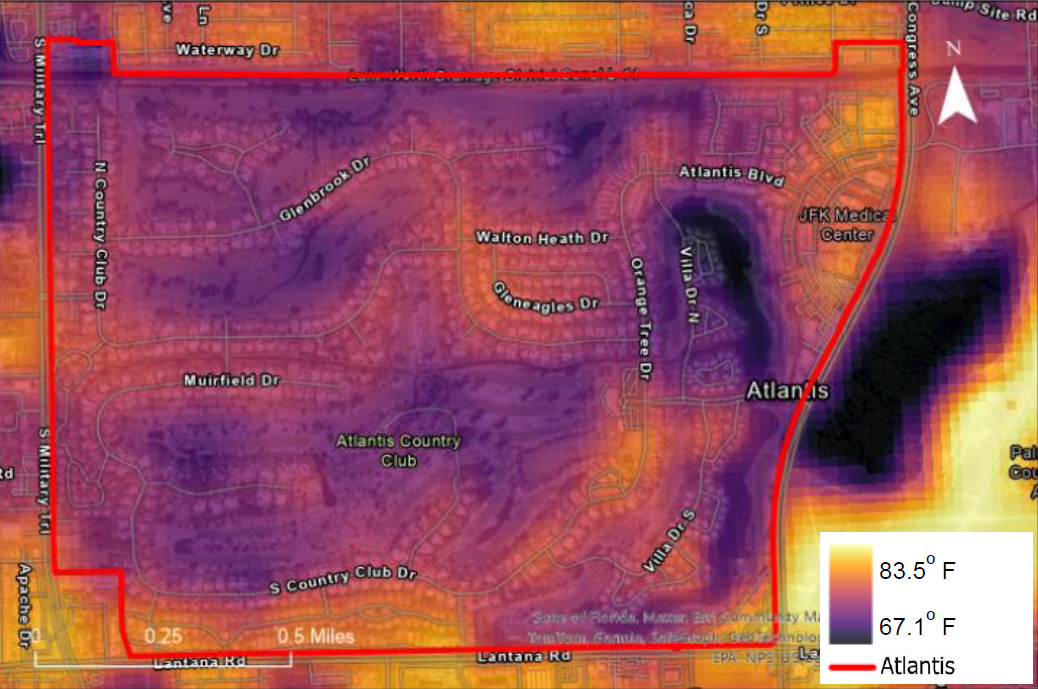
Despite having overall lower surface temperatures than the surrounding areas, Atlantis has three prominent heat islands. Two of these are non-residential areas, a commercial area on the southeast corner of Atlantis, where the highest average surface temperature (83.5°F) is located, and a medical center on the northeastern corner of Atlantis. Not surprisingly, these two areas have low canopy cover (0–13%) and high impervious surface percentages (50–100%) (Figure 3).
Key findings
The third and largest heat island is a residential area along the southern border of Atlantis, where the highest average surface temperature is 79.9°F, and residents likely experience noticeably higher felt temperatures. A combination of high impervious surface area and heating from the adjacent area south of Atlantis, where average surface temperatures reach 80°F, contributes to higher temperatures in this part of Atlantis.
There are other residential areas in Atlantis where average summer surface temperatures are higher than the surrounding landscape by 1 to 2°F. This may not seem like a big difference, but keep in mind that surface temperatures in these areas are still 6 to 7°F higher than tree-covered areas, and as both average temperatures and the frequency and severity of temperature extremes increase over time, these differences in surface temperatures will also increase.
Atlantis is not representative of the challenges facing most municipalities. Atlantis is a small city with a relatively low population density, and whose residents, although older (median age is 63), are also more affluent, and thus less vulnerable. The City’s green spaces, low density, and greater resources give it greater potential to enhance its climate resilience than most cities. That is of course, if Atlantis is interested in doing so.
Heat Mitigation Opportunities
One of the takeaways from this simple analysis is that surface temperatures in Atlantis are lower than in the surrounding communities, thanks to the extensive use of water to irrigate the golf courses. However, as temperatures increase, so will the demand for water and the need to reduce groundwater use to allow vital flows of water into the Everglades ecosystem. This means that irrigation of the golf courses alone cannot maintain lower surface temperatures in perpetuity. With 55% of Atlantis having less than 1% tree canopy cover, it can be expected that as temperatures increase and the hot season becomes longer, surface temperatures in the residential areas with little tree cover (most having less than 20%) will increase – raising the costs of cooling homes and making felt air temperatures noticeably hotter for people, plants, and pets.
Even this relatively simple temperature analysis can help to maximize efforts to lower surface temperatures now and in the future by identifying where tree cover is more likely to reduce surface and air temperatures. Planting trees to increase tree canopy shade and plant cover would make Atlantis more resilient to rising temperatures and provide additional benefits, such as reducing water and energy consumption and health risks. In short, it would help maintain the quality of life that the residents of Atlantis have enjoyed.
Don’t hesitate to reach out to us and start a conversation about enhancing or developing a resilience plan for your community or business.